Creating a dashboard
To create a dashboar, head to https://app.supaboard.co/dashboards (opens in a new tab) and open the dashboard menu in the top bar. From there, click on the "Create a new dashboard" button.

From the modal that appears, you can choose a name for your dashboard and save it.
Adding charts
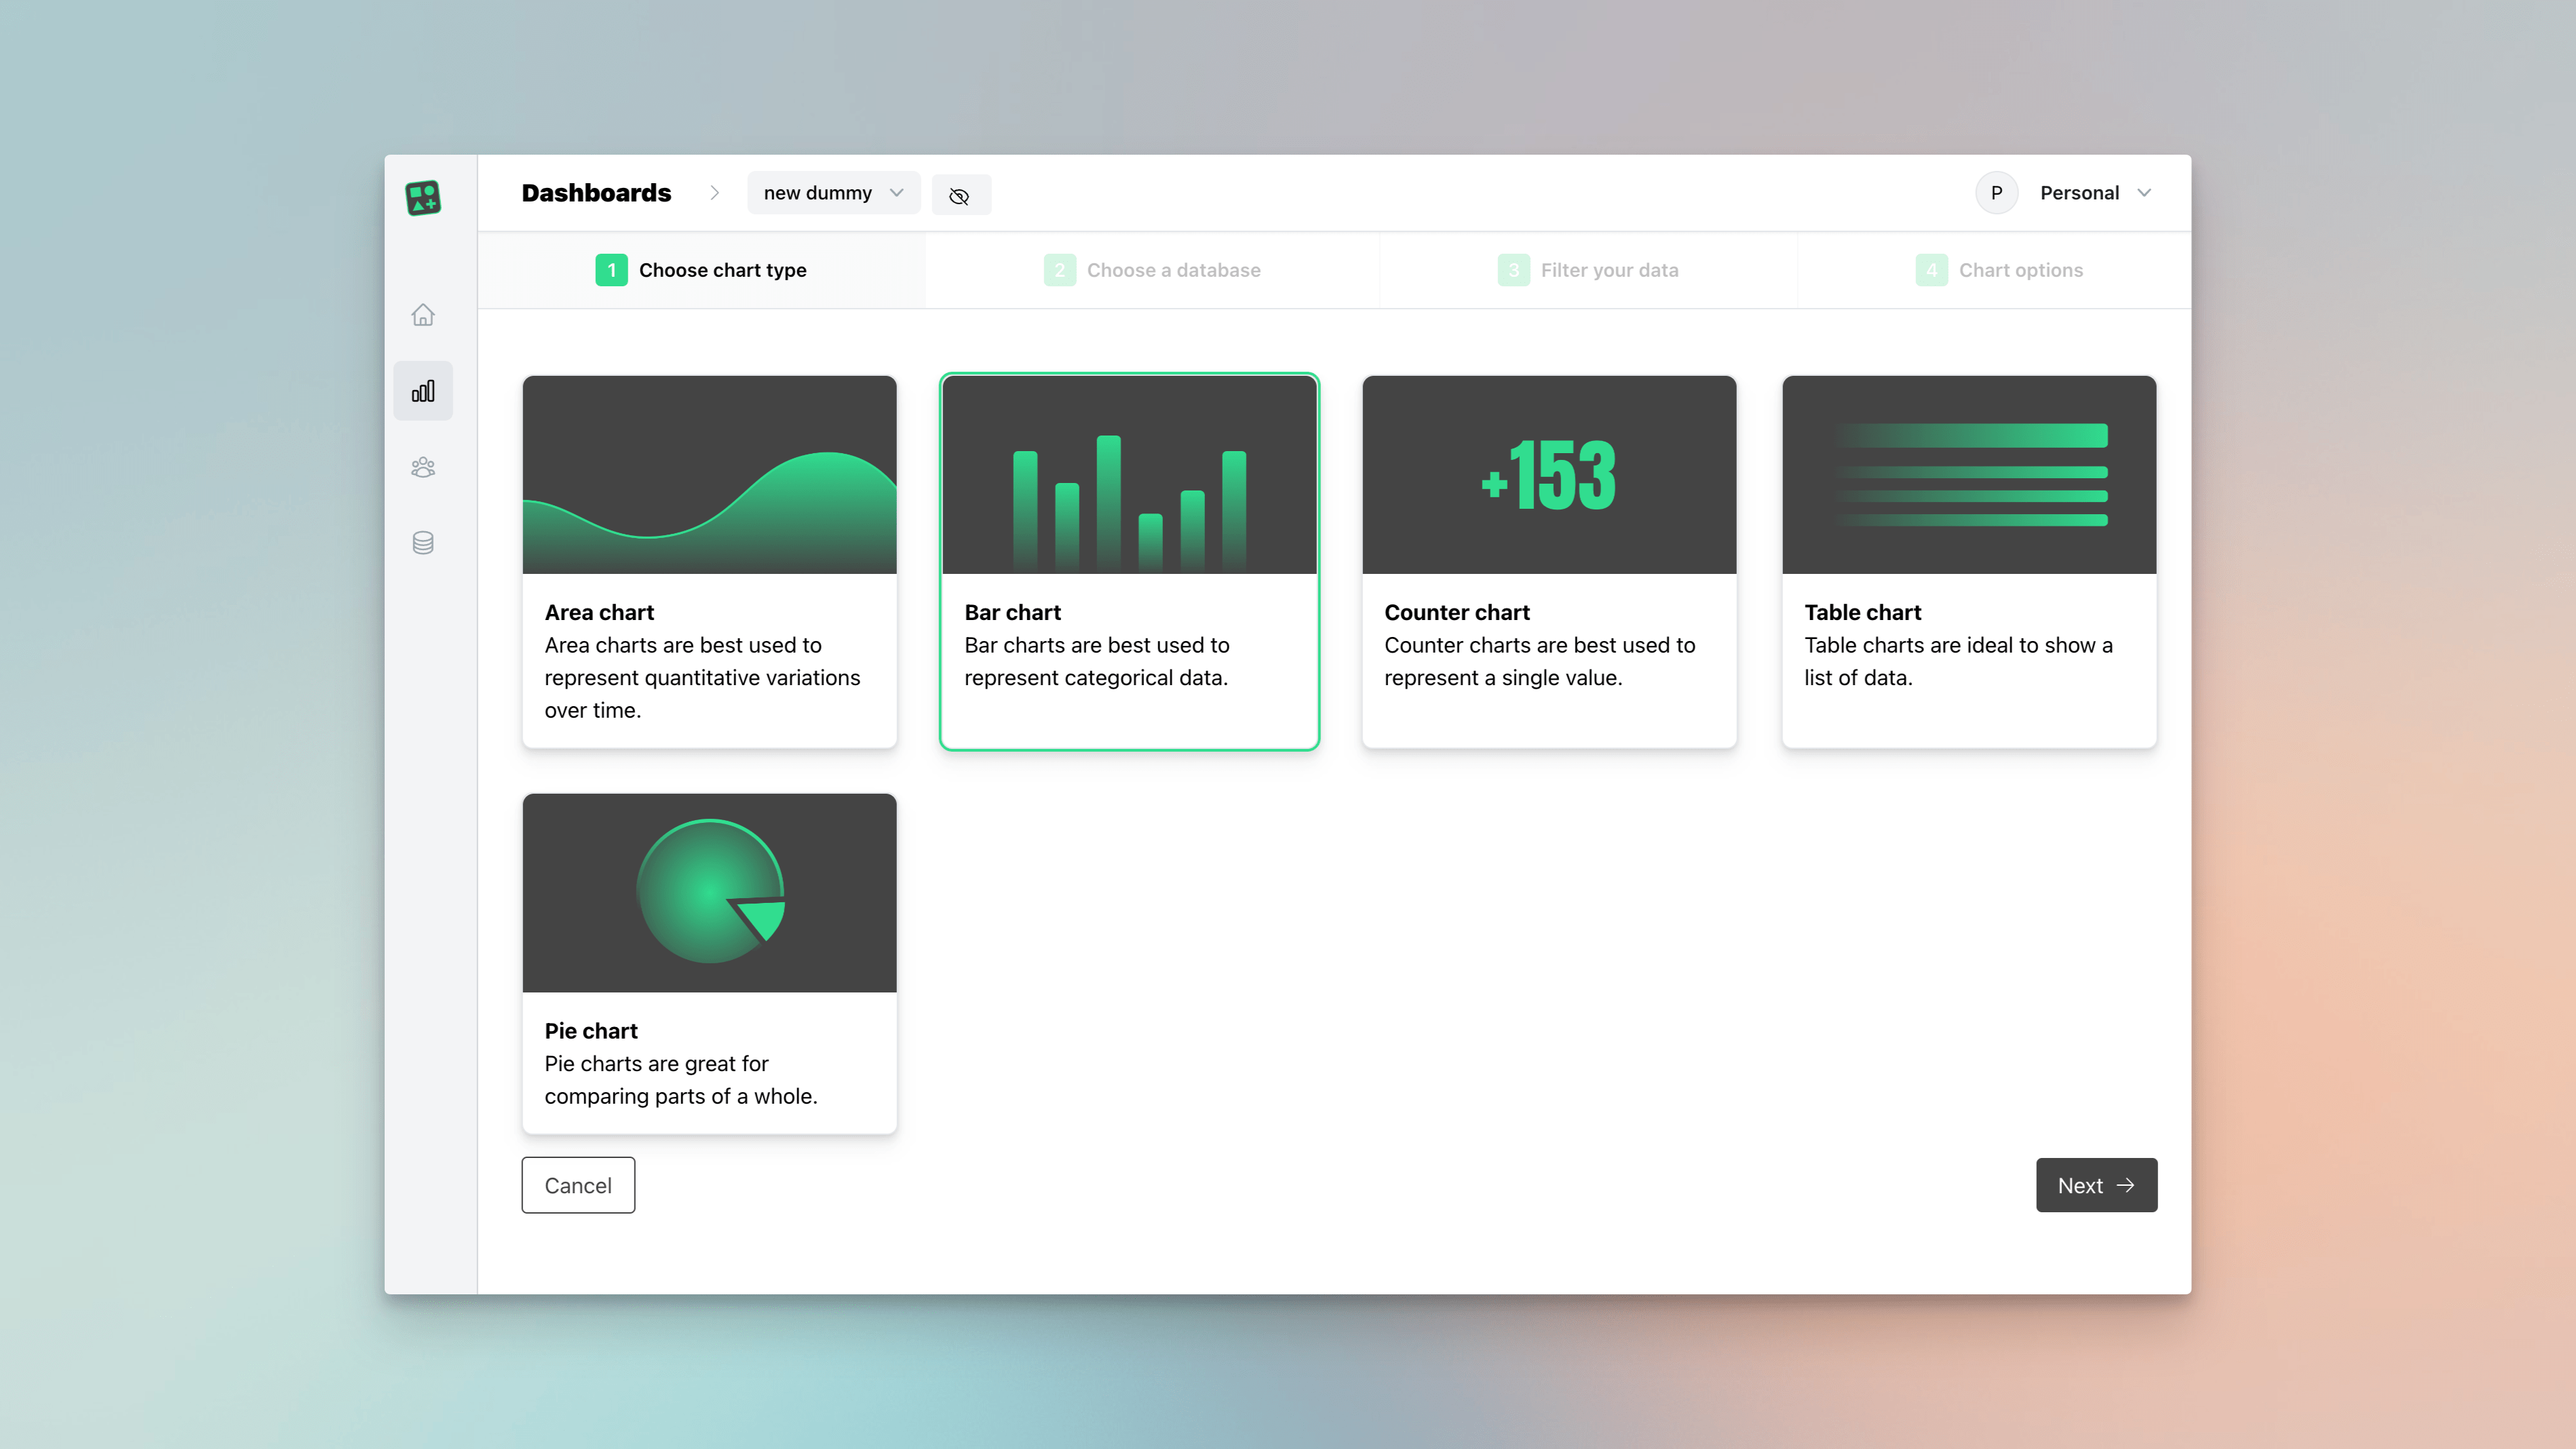
Once you have created a dashboard, you can add charts to it. To do so, click on the "Add chart" button in the top bar.

From the following wizard, you can choose the type of chart you want to add, and the data source you want to use. Each chart usually requires you to set a data column and a time column that will be used to display the data. Some charts may require additional or even less configuration, like the "Counter" chart that only requires a data column.
Adding data
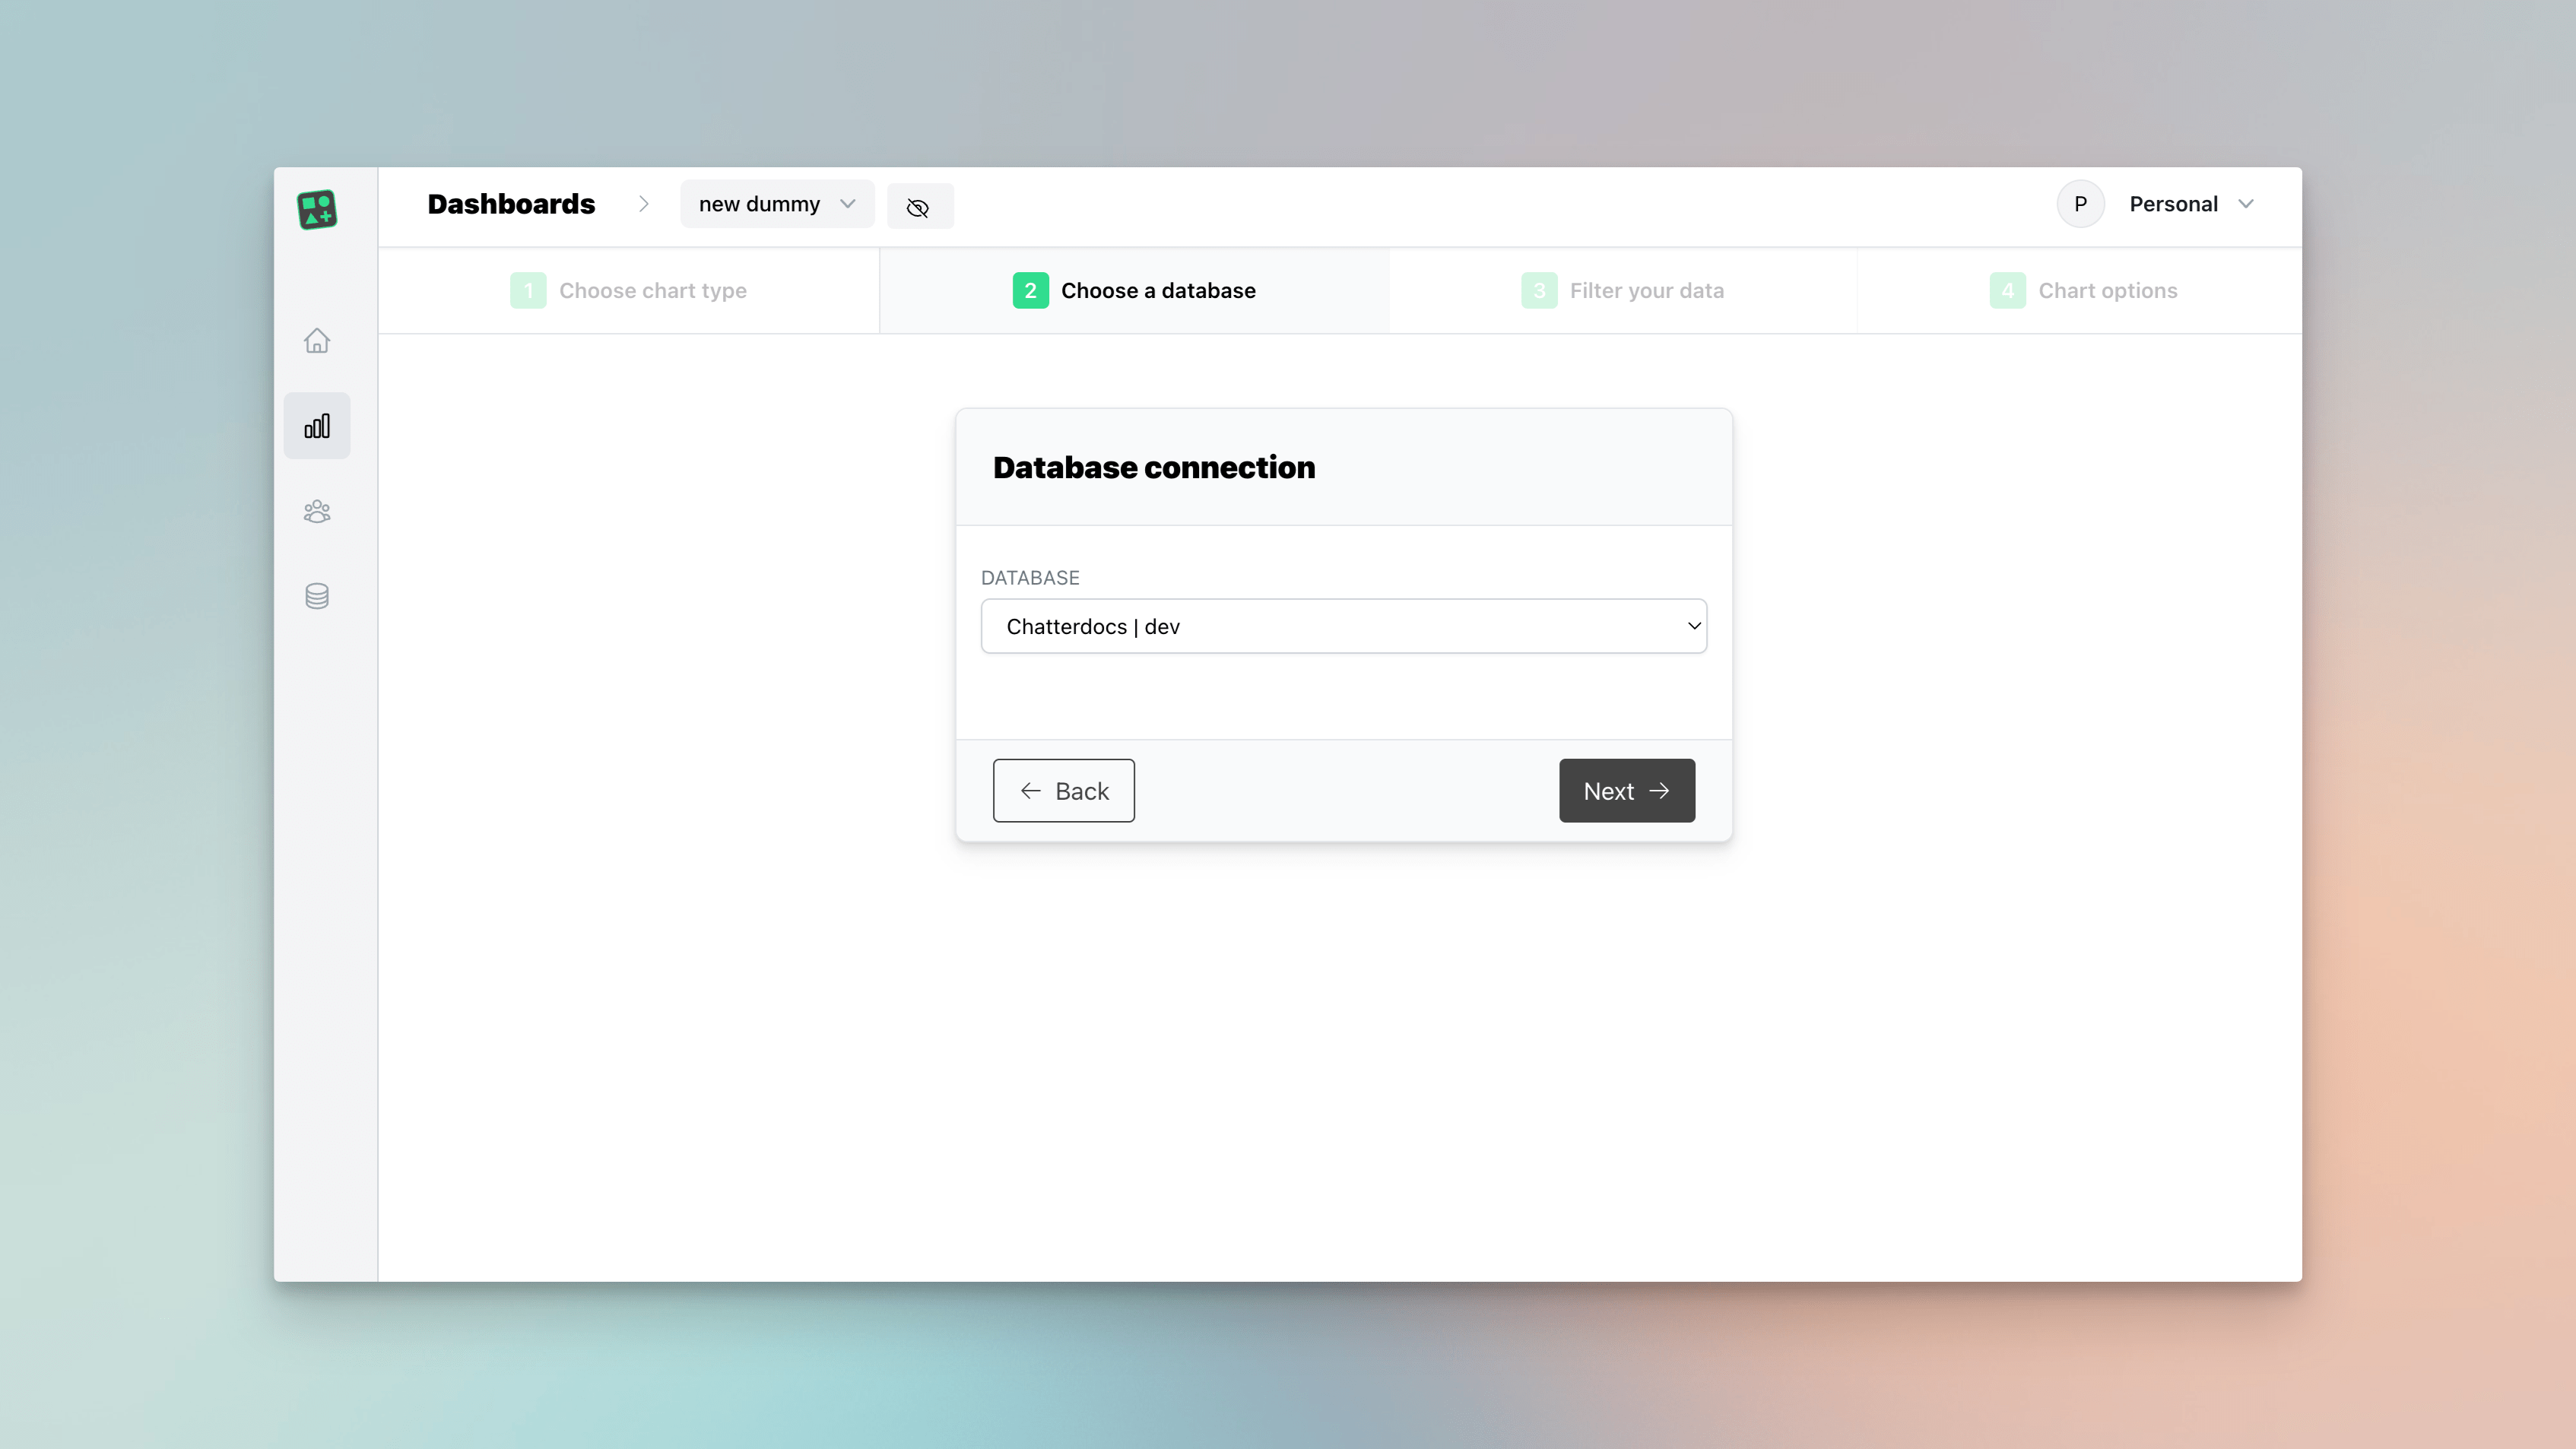
As mentioned above, the next step of the wizard will ask you to select the data column and the time column. You can do this through the simple GUI, which allows for simple queries with WHERE clauses, or by writing more complex queries (e.g. JOINS) in the advanced tab.

For the advanced queries, make sure to also define the data and time column and include them in your SELECT statement, as they are required for the chart to work.

In the following and last step, you can give your chart a name and add a helpful description. Once you are done, click on the "Save chart" button to add the chart to your dashboard. You can always edit the chart later by clicking on the "Edit chart" button in the top bar to the chart.